Stock Trading
Navigate potential stocks and join in on a soaring market!


How to read the analytics & the statistics of the stock market?
Investing in the stock market is often followed by the statistics presented by the websites. Some stock market websites provide valuable statistics regarding the performance of stocks and the stock market. It is critical for any investor to understand the indicators, charts, analytics, and stats that are provided by the stock market websites before investing in the market. Aspiring equity investors cannot constantly seek help from others to understand the technical indicators of a stock, and they must learn how to do all the number crunching for themselves to save time in researching the stock's performance.

Why learn statistics and data analysis performance?
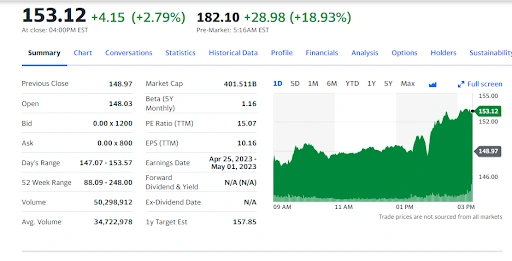
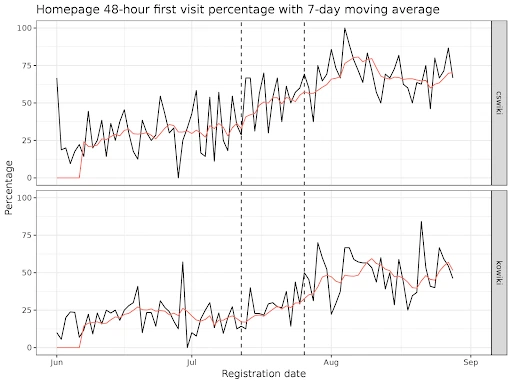
Note: The above image is sourced from the website that provides stock analytics,
it helps the raiders to understand how the figures and analytics look.
How do you analyze a stock market or a stock?
There are several key indicators and performance statistics to analyze a stock. A trend shown in the analytics website helps traders for analyzing a stock. The data used for stock market analysis are:
Earning per share
Earning per share is the company’s net profit divided by the number of outstanding shares. The measure of earnings per share is used to evaluate a company’s financial worth.
Example of how EPS is calculated:
| Name of the Company | Net Income generated | Preferred Dividends | Company’s outstanding shares | EPS |
|---|---|---|---|---|
| Tesla | $8.5B | $0 | 4.28B | $8.5/4.28 = $1.985 |
| Berkshire Hathaway | $24.56B | $2.67B | 11.23B | $24.56-$2.67/11.23 = $1.949 |
| Microsoft | $2.34B | $0 | 1.10B | $2.34/1.10 = $2.127 |
What is the P/E ratio?
The P/E ratio is the ratio of the current share price relative to its earnings per share (EPS), sometimes known as the earnings multiple. The P/E ratios help investors and analysts determine the relative value of a company's shares in an apples-to-apples comparison.
How to understand the trend chart?
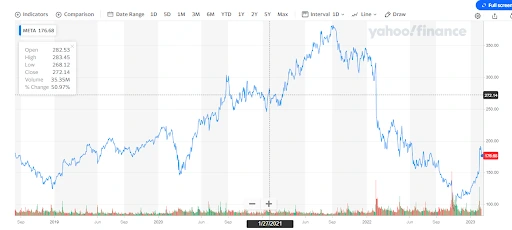
The above chart is a trend chart that shows the daily trend of a stock.
The trend chart in stock market analysis represents the price of a stock at a particular date. When the pointer hovers over the trend line, it shows the following data of stock on a particular date: the open price of the stock, the day’s high, the day’s low, the day’s closing price, the volume of stocks traded that day, and finally, the % change in the stock price to its previous day is shown almost all the stock analysis websites.
The horizontal line in the chart shows the timeline with the date, month, and year. The vertical line in the chart shows the moment of price with respect to the date. However, the chart further gives details such as the open price, close price, the day’s high and the day’s low, etc. The chart shows the past ten years' price data of the stocks. The trend line/trend chart is used in trend trading to help investors trade stocks better.
Market capital
Market capital is the total value of all company stock shares. Multiplying the price of a stock by its total number of outstanding shares gives the value of market capitalization. For example, a company with 40 million shares selling each share at $25 would have a market cap of $1 billion. Market capital tells the investors how big the company is with respect to other companies.
Companies are further divided into three categories depending on the size of the market capital: Small-cap, Mid-cap, and Large-cap.


Small-cap
Small-cap companies typically have a market value of $300 million to $2 billion. Usually, these are start-up companies that serve niche markets or emerging industries. Small caps are considered the most aggressive and risky of the three categories.

Mid-cap
The mid-cap companies will fall between Small-cap and Large-cap. The mid-cap companies have a market capitalization of $2 - $10 billion.

Large-cap
Large-cap companies have a market capitalization value of more than $10 billion. Large-cap companies are safer to invest in as they are transparent and consistent in giving dividends.
What is the 50-day & the 100-day moving average?
The 50-day moving average is presented by plotting the recent 50 days closing price of a stock, and the average of the 50 days closing price are calculated. Likewise, the 100-day and the 200-day moving average are also calculated in the same manner.
Apart from the above data, there are a few more statistical data that are presented in the statistics column of any stock-related websites.
Stock market analysis

How do you analyze a stock market?
There are two different types of fundamental analysis: qualitative and quantitative.
| Quantitative fundamental analysis: | Qualitative fundamental analysis: |
|---|---|
| This type of analysis is beyond the numbers, figures, and statistical data, rather it considers the promoter's attitude, the promoter's intent, and the business model. | It is the numerical and statistical data, showing numbers, ratios percentages, and also a graphical representation of the stock performance. |
| 1.Balance sheet: The balance sheet is a financial statement showing a company’s assets, liabilities, and equity. The formula: Assets = Liabilities + Shareholders' Equity is used to balance assets, liabilities, and shareholders, thus calling it a balance sheet. Assets are any properties, bonds, stocks, and liquid cash. The other side of the equation represents the total amount the company has used to acquire those assets. | 2.The working of business: The working of the business is understood by knowing how the business is running, its plan of action, motives, targets, and strategies. Every business adopts its business model to distinguish it from other businesses, despite many businesses choosing the same industry. |
| 2.Income statements: The income statement records a company's performance over a specific time. The income statement includes a company’s income, expenditure, and profits generated from the business operations for that period. | 2.The promoters' attitude: The promoters' attitude is key in the fundamental analysis as it cannot be measured numerically. Investors or traders should keep their eyes and ears open to the news and statements made by the promoters to know their intent in promoting a business. In this way, it helps the investors to predict the risk early before it makes headlines. Promoters' relations with the investors are also considered in the qualitative fundamental analysis. |
3.Cash flow statements: The cash flow statements typically represent a record of a business' cash inflows and outflows over some time. Typically, a statement of cash flows focuses on the following cash-related activities:
|
3.The industry of a stock: For a stock to improve or grow, it must be in a sector or industry which is in demand. The key driving force of any business is demand, and hence the industry in which a company is operating must be in demand. |
Technical analysis is a trading discipline employed to evaluate investments and identify trading opportunities by analyzing statistical trends gathered from trading activity, such as price movement and volume. Unlike fundamental analysis, which attempts to evaluate a security's value based on business results such as sales and earnings, technical analysis focuses on the study of price and volume.
Market Basics
Strategies
Beginners Guide
Best Way To Trade Stocks
Frequently Asked Questions
Who analyzes the stock market?
There are few specialized firms to analyze the stock market and stocks to help and guide investors and traders, but they charge a commission for conducting the analysis. Wealth managers and investment advisors are often involved in this activity.
Can data analysis help in the stock market?
Yes. Data analysis helps traders and investors to make appropriate trading decisions and invest more efficiently. Data analysis is often done for short-term trading purposes as the traders book profits in price fluctuation.